

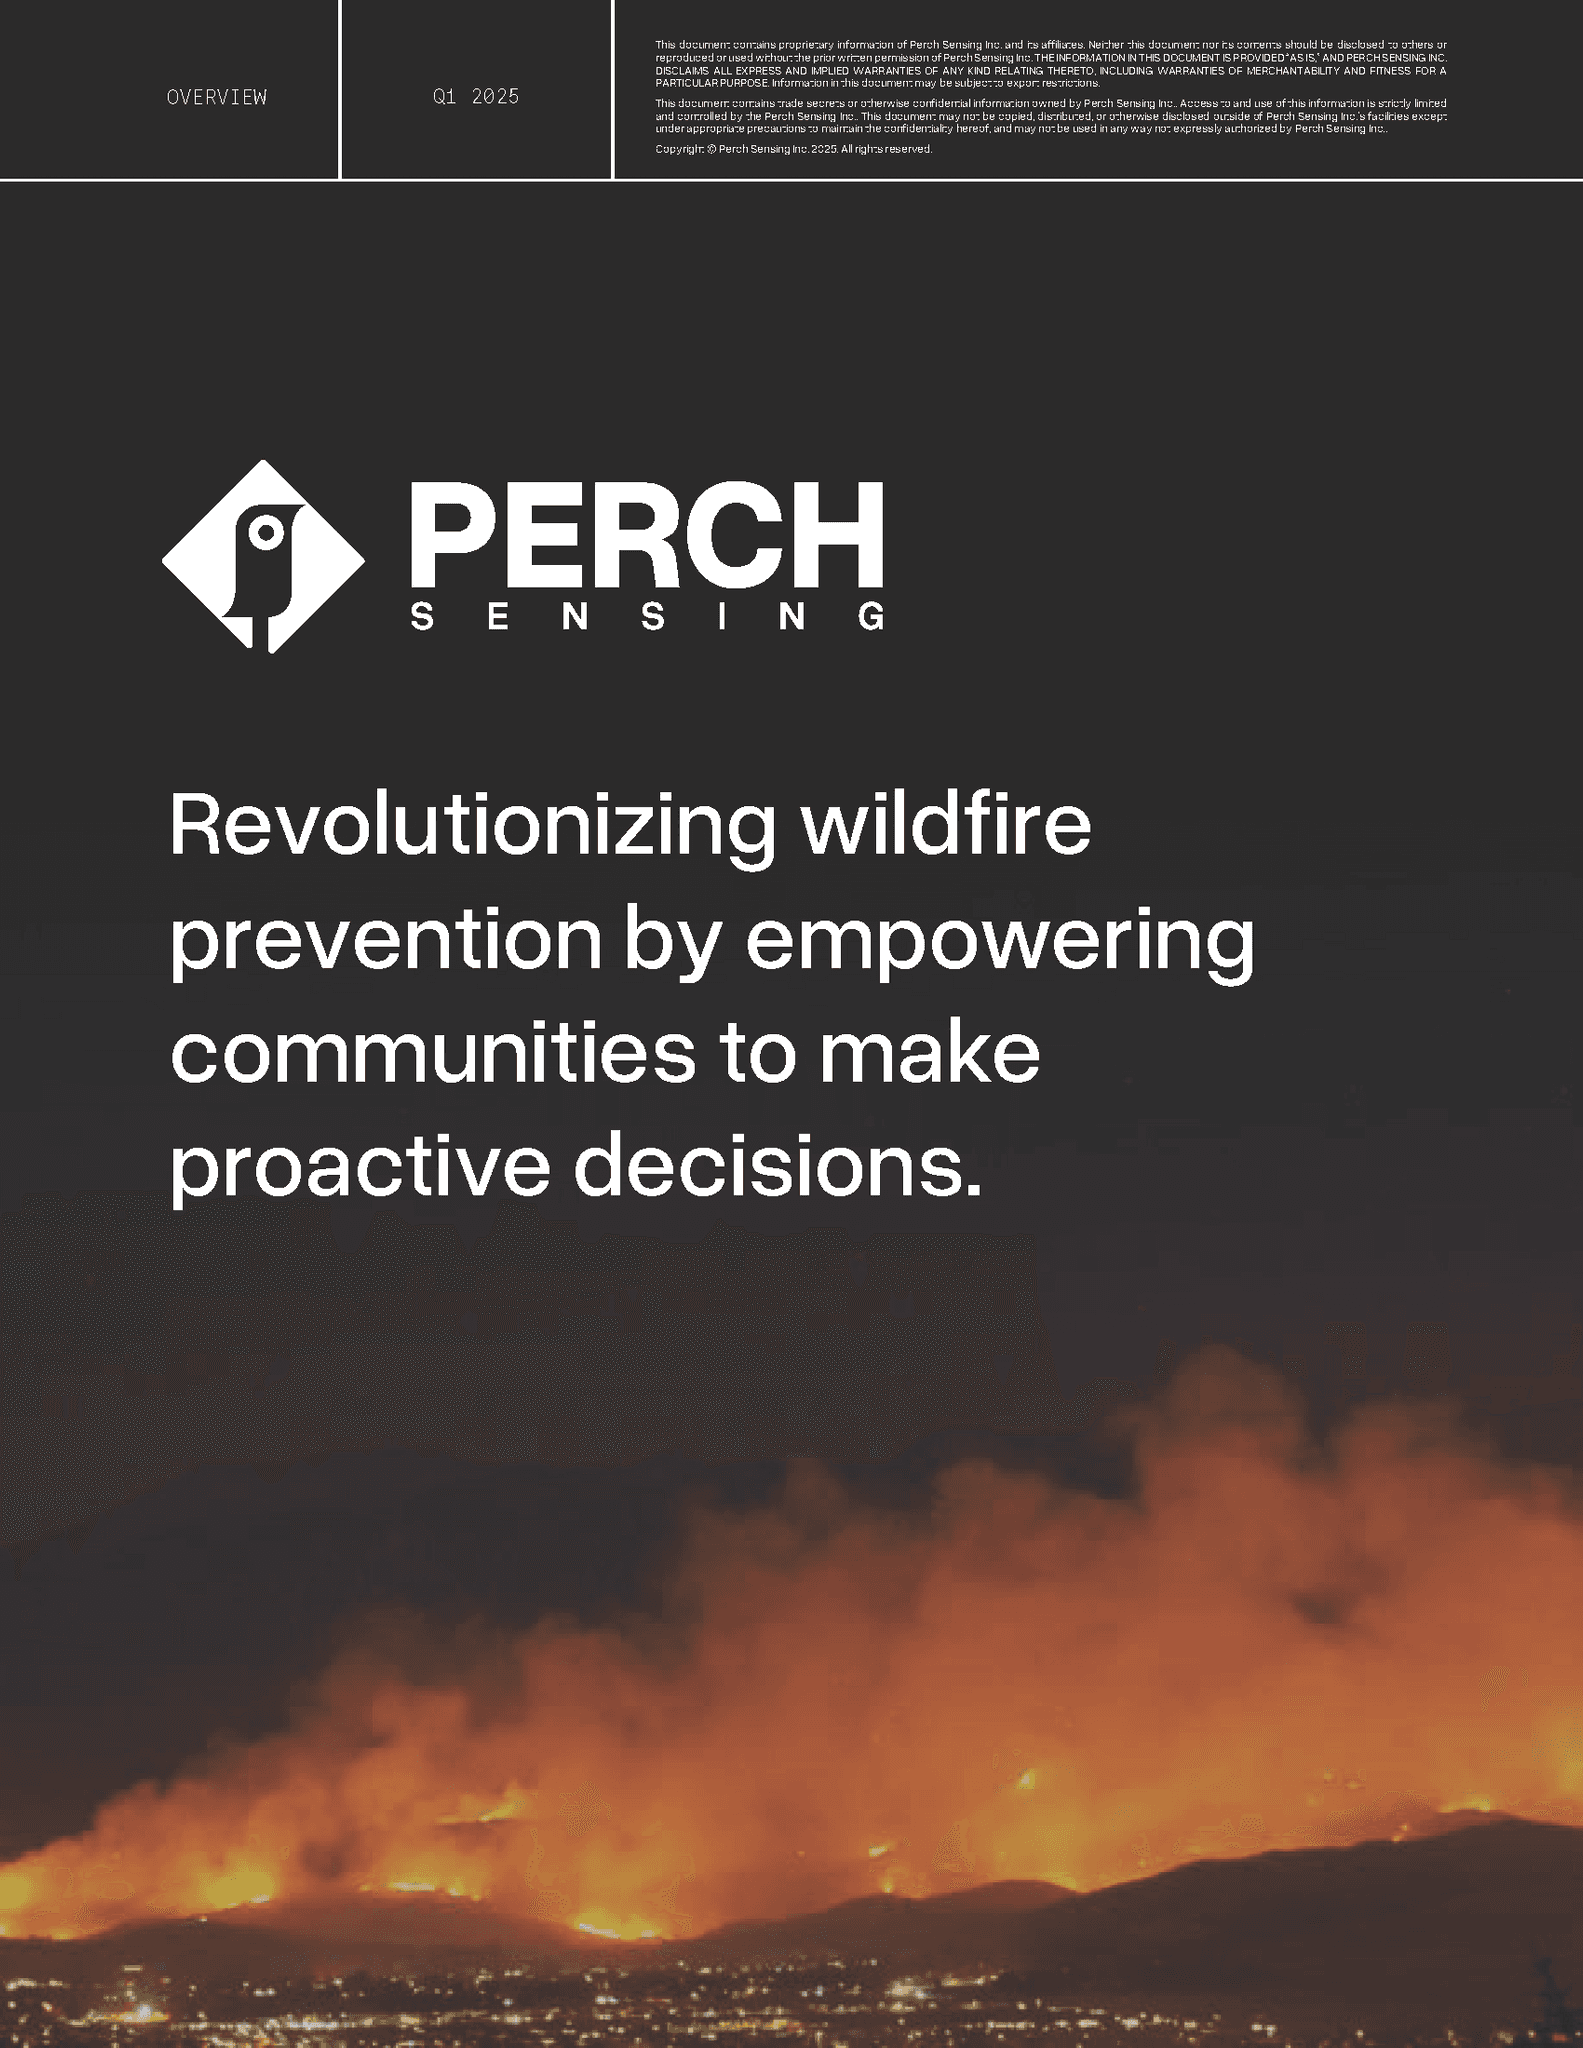
Overview
Goals:
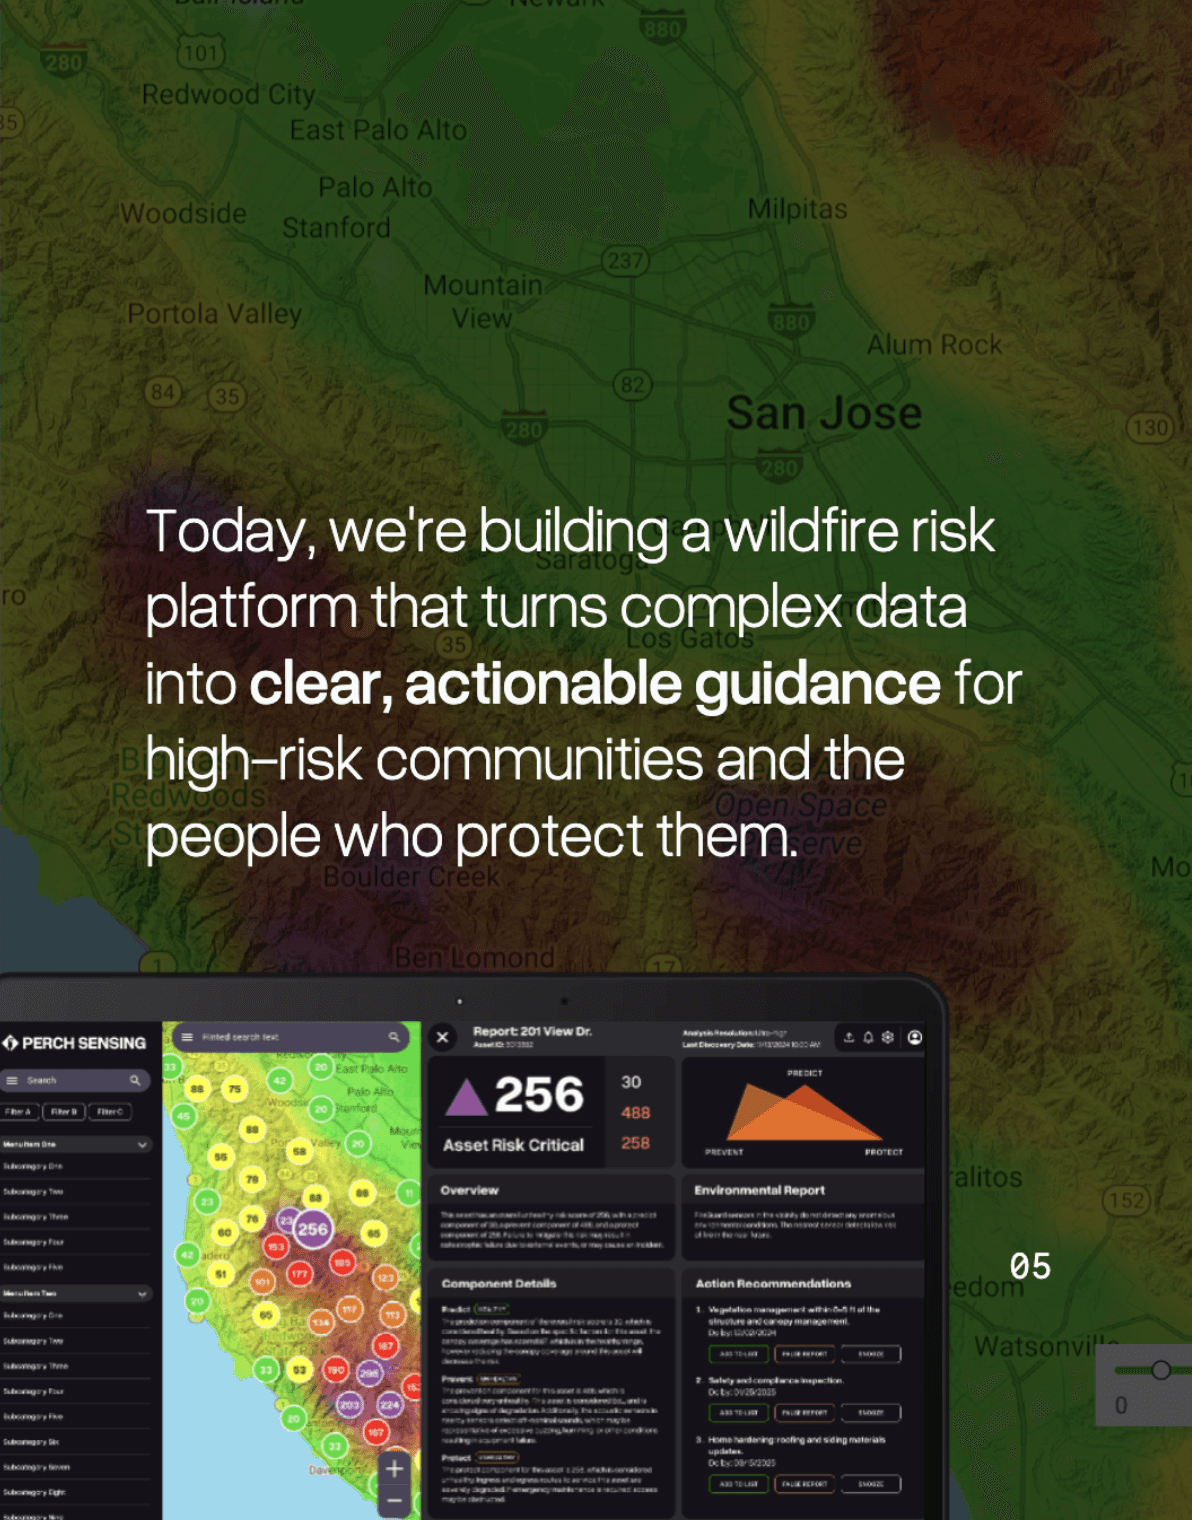
Explain risk fast (P3 score + driver breakdown)
Drive mitigation behavior (recommendations + prioritization)
Make the system scalable (IA + components for a data-heavy platform)
Founding Designer
UX research, product strategy, IA, interaction + UI design, prototyping, content + microcopy, lightweight marketing/ launch design
CEO, CTO, algorithm lead, engineers, web developers
2024 – 2025
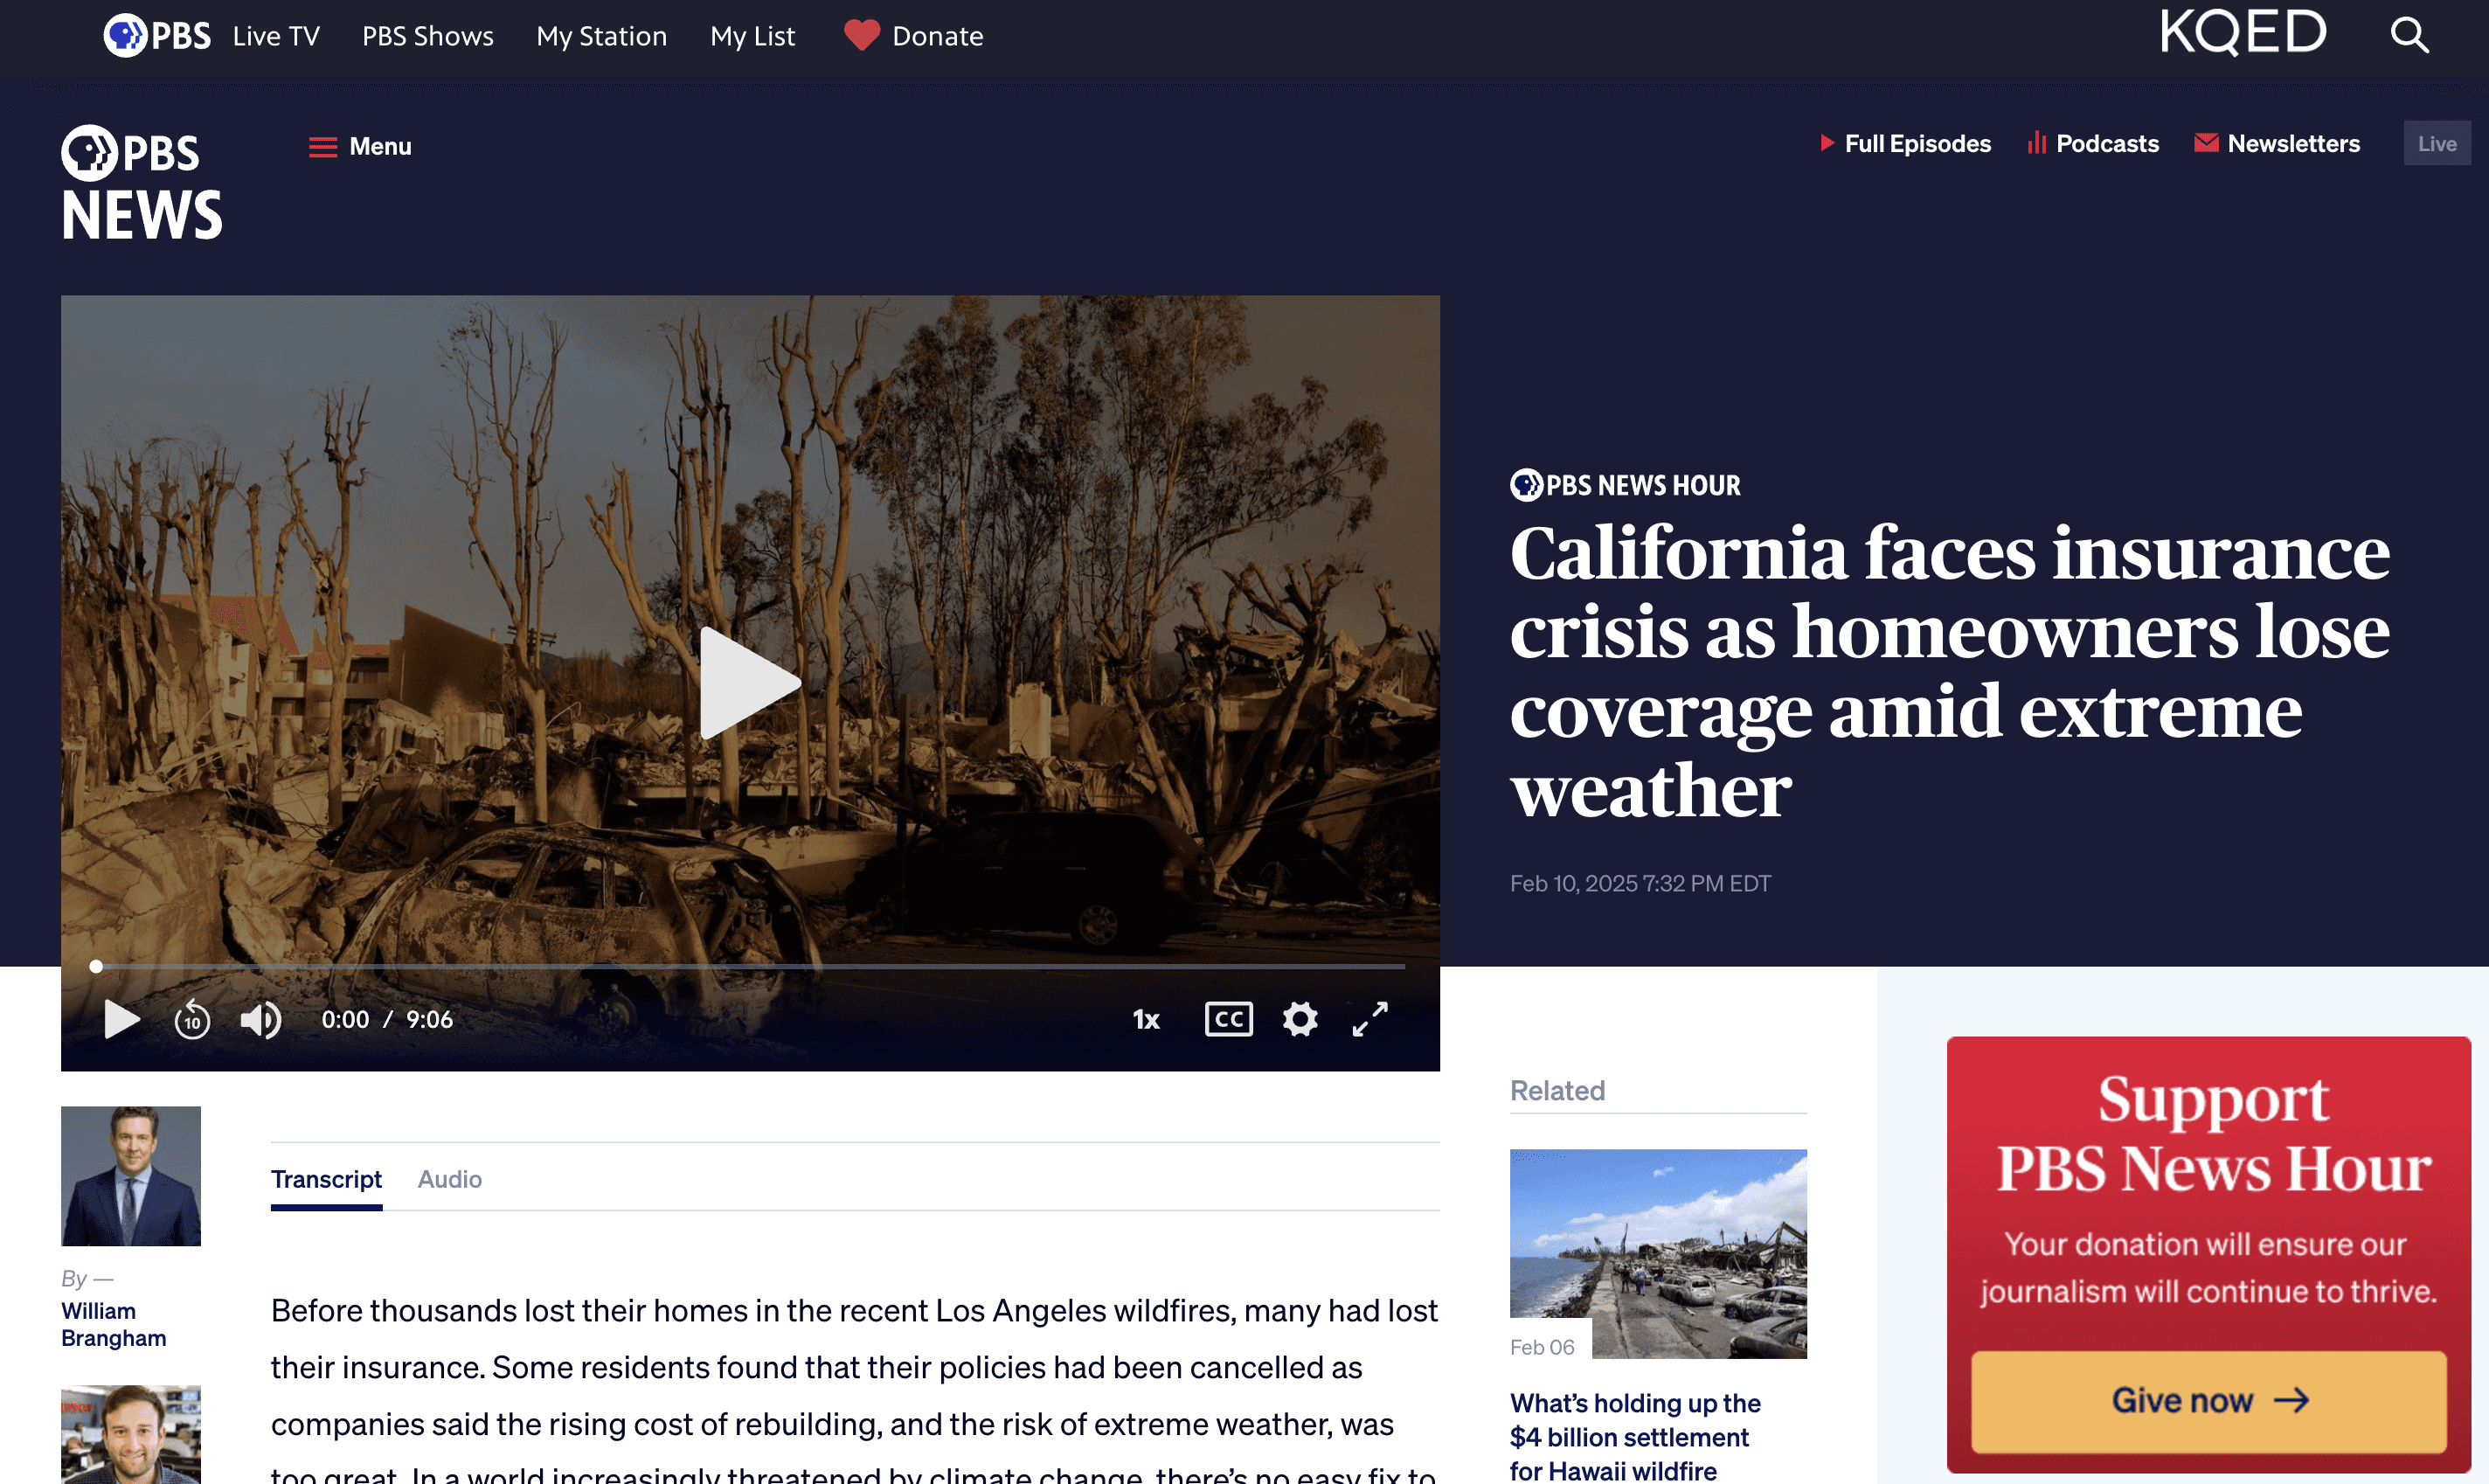
Wildfires are becoming more severe. Insurance policies are being cancelled.
Wildfire risk is rising, and people are being asked to make expensive decisions (home hardening, brush clearance, insurance changes) without a clear, trusted way to understand their risk. Existing tools either overwhelm users with maps and jargon, or fail to connect risk to clear next steps.
So the product needed to do two things at once:
Communicate complex risk credibly
Motivate practical mitigation behavior


Helping people act on wildfire risk, not just observe it.
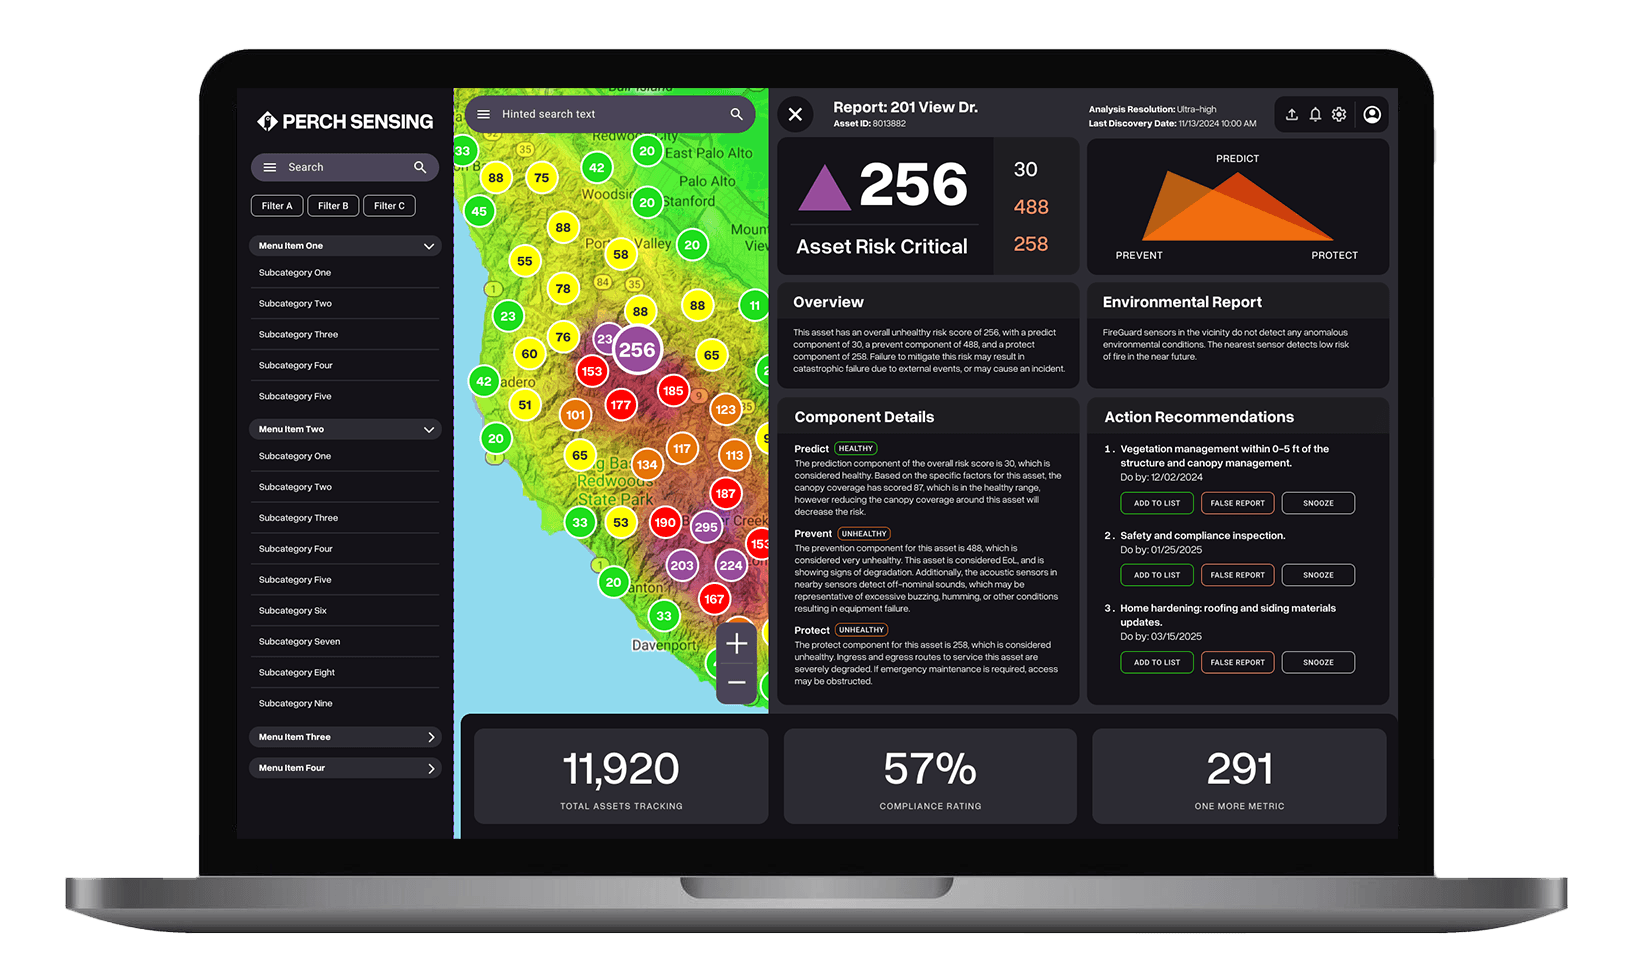
I designed an explainable wildfire risk experience centered on the P3 Score. To reduce overwhelm, I organized risk data into three pillars (Predict, Prevent, and Protect) and paired a top-level score with a clear driver breakdown and prioritized actions matched to effort and impact.

Predict
likelihood + contributing signals

Prevent
prioritized actions + expected impact

Protect
community context + resources
Key Decisions
Trust-first design
Made the score explainable so users understand why it’s high and how to lower it.
Progressive disclosure
Kept the first-time experience simple with details available just a click away.
Action framing
Turned findings into achievable tasks with clear, prioritized next steps.
The process
Pivoting from wildfire sensors to risk assessment software
Perch began as a hardware + sensor concept, but early discovery showed the fastest path to value was software: a risk model paired with practical recommendations. I helped drive the pivot by:
Interviewing target users to validate pain + language
Synthesizing into product direction + P3 score framework
Prototyping flows to align engineering + stakeholders

Designing without a finished product
We designed in parallel with an evolving data model. Prototypes became the shared spec while we aligned on inputs, outputs, and language. To keep momentum without “waiting for perfect data,” I used prototypes to:
Define required inputs + outputs with engineering
Test comprehension and trust language with users
Pressure-test IA and drill-down patterns early


Driving participation
Social Presence + Research Recruitment
In parallel with product design, I led early efforts to build awareness and drive participation. I created a lightweight social strategy, posting calendar, and custom graphics to introduce Perch’s mission and establish a clear narrative.
The goal was to build enough signal and trust to support ongoing research, conversation, and early engagement.


Survey Design
As designs progressed, we realized we were missing clarity on who we were building for and what they’d actually need. I paused feature work to run user research and validate our target users, language, and core needs.
I launched a branching survey and began targeted interviews with homeowners, insurance reps, and fire professionals. Their insights directly shaped the next phase of product direction, language, and prioritization.
Impact
25+ user interviews across homeowners, insurers, and fire professionals
42 survey responses with 10+ follow-up interviews

The outcome
By the end of my time with Perch, the team had a clear product direction, an explainable risk score framework, and a prototype foundation informed by 25+ interviews and 42 survey responses. This work aligned stakeholders, clarified target users, and guided early product and data decisions.
What I delivered
Direction for the product + business
research-backed positioning, target users, and MVP scope
P3 score UX model
top-level score + driver breakdown + plain-language explanations
Action item flows
prioritization logic + recommendations + next-step UX
IA + UI patterns
information architecture + reusable components for data-heavy screens
Marketing assets
social storytelling + recruitment support for research